The SAVE Customer Model provides a household typology of 22 ‘customer types’ defined by household size, dwelling size and primary heating fuel. Each of these characteristics was shown to be associated with variation in electricity demand. By allocating the correct proportion of households (and linked demand profiles) by customer type to each small area using Census statistics, and the impact of the specific mix of household characteristics is reflected in the distinct aggregate load profile for each Census Output Area. The method, called spatial microsimulation, is shown simplified in Figure 1 below. In the example, mean electricty demand profiles from the sample population (grouped according to the number of occupants in each household) are assigned to each area according to the number of households in each category. In Area (1), 4 profiles for 3-person households and 2 profiles for 4-person households are used. Different profiles are assigned to Area (2) as shown in the figure. The final Customer Model used the three household characteristics identified above (the customer typology) to assign profiles to each Output Area.
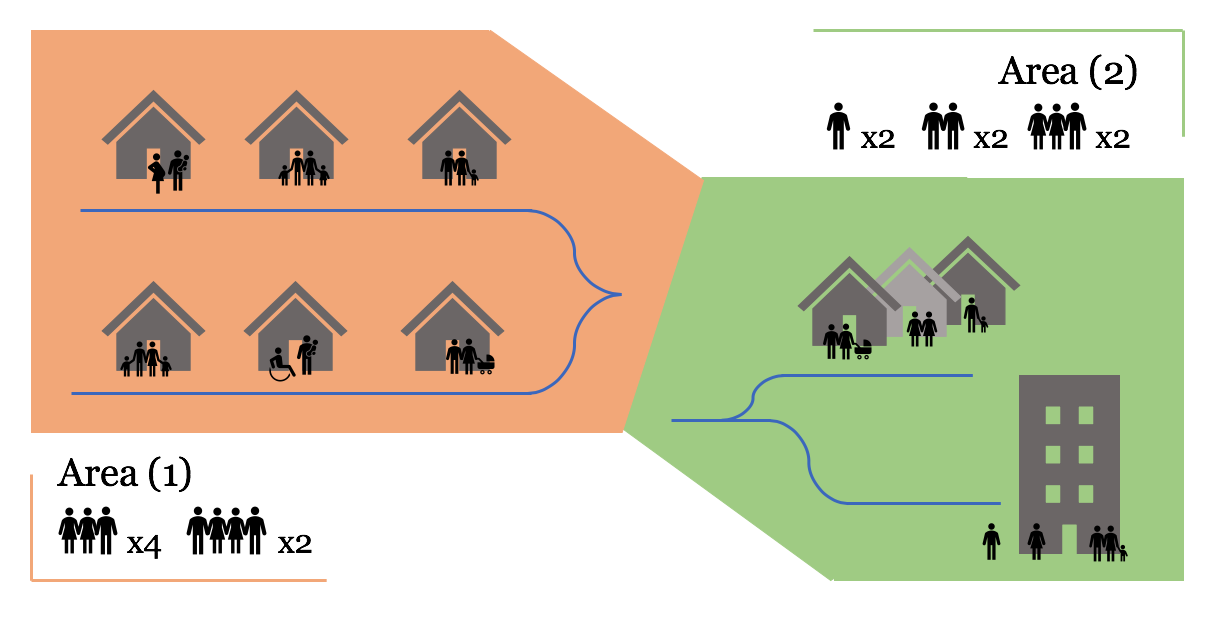
Figure 1: Small area estimation, conceptual diagram
As network topologies can be mapped to Output Areas, the process extends to mapping the loads disaggregated by household characteristics to network elements defined by geography and thus applied to network simulation tasks.
The results shown here illustrate the estimated electricity demand for a representative winter weekday and were produced using electricity consumption data collected from the SAVE sample households; designed to be representative of the ‘Solent’ region of Southampton, Portsmouth, Hampshire and the Isle of Wight.
How to use this map:
Explore the SAVE Customer Model results using the map below. Click within an Output Area to view details in a pop-up window, including the estimated aggregate daily load profile for each Output Area (in 30-minute periods).
Click and hold to reposition map. Click +/- (top left of map) to zoom.
To access the full functionality of the mapping application, click on the ‘Large map’ button below (opens in a new tab). The map accessed through the link incorporates multiple layers providing loads for each Output Area at the household (mean) and area level (aggregate). In addition, information on household characteristics (source: nomis) and from the Energy Performance Certificate (EPC) database (source: EPC register) are also included.
![]()
More information:
For further information on the SAVE project, the randomised controlled trials into energy efficiency and behavioural change, and modelling conducted, refer to SAVE related pages on this website (Sustainable Energy Research Group, University of Southampton) and SAVE project website (external link).