Experimental Tests – Array Project
Fig. 1 – Plan view of a turbine array. Downstream row performance is clearly affected by wake of upstream devices.
Marine current energy conversion technology is presently at the prototype stage where single devices are deployed, or planned for installation, at isolated testing sites. In the medium term, however, devices will be installed in arrays (Figure 1). Understanding the effect devices have on the flow is critical in determining how one device may modify both the performance of and loading experienced by another device in the array. It is the aim of this work to identify and investigate the parameters which govern the wake structure and its recovery to the free-stream velocity profile.
Fig. 2 – Measured velocity deficits downstream of two different rotor disk types.
Scale model testing is being conducted to aid the development of an efficient numerical model. As a marine current turbine extracts energy from the tidal current a wake forms downstream of the rotor. This takes the form of a gradually expanding cone of fluid that has a velocity less than the fluid that passes around the rotor. As the wake travels downstream its mean velocity increases as it mixes with free stream fluid. Figure 2 shows how the velocity recovers from some model scale experiments conducted in a large flume.
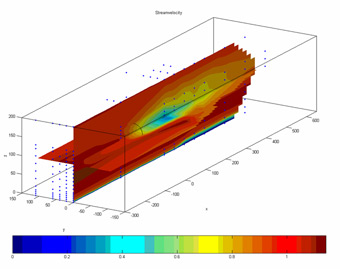
Fig. 3 – 3D interpolation of measured velocity deficits downstream of two different rotor disk types.
The velocity deficit it essentially the decimal percentage of the upstream speed so a velocity deficit equal to zero equates to the flow speed being equal to that upstream of the rotor (0.2 is 80% upstream speed etc.). It is clear that the wake can recover at different rates and that it can take a long distance downstream to recover to 90% of the upstream speed.
This work is being conducted by SERG along with Garrad Hassan who is responsible for developing a 3-D numerical model that will be validated by experimental data from SERG. Further partners are Lunar Energy andSMD Hydrovision. Figure 3 shows a visualisation of the wake flow downstream of a mesh disk rotor simulator tested at the 21m Civil Engineering flume at the Chilworth Hydraulics Laboratory (Figure 4). The blue dots represent points where mean velocity and turbulence intensity was measured. The blue colours immediately downstream of the disk show that the fluid is immediately slowed quite dramatically. As the wake continues downstream the velocity starts to increase and the wake expands as described earlier.
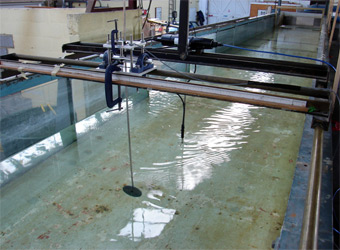
Fig. 4 – Photograph showing the layout in the 21m Civil Engineering flume.
This work is funded by the Department for Innovation, Universities & Skills (formerly DTI – Department of Trade & Industry) and will end in 2008 shortly before the first marine energy converter arrays are due to be installed.
2D Farm Simulations
Fig. 5 – Variation of thrust with flow speed for simulated generator unit.
Little is known about the possible effects that a large number of tidal turbines would have on the local tidal regime. Having some idea is important, not only for the purpose of predicting power output (it could be reduced due to reduced flow speeds), but also for environmental impact assessment.
Field data on these effects are lacking, as arrays of turbines are yet to be constructed; the effects are also difficult to reproduce in physical models due to scale effects.
It was decided to go down the route of CFD simulation for this work as it was necessary to simulate tidal streams around the headland in the first instance due to the sparsity of available tidal stream data. However, individual turbines are too small to be simulated directly in a coastal numerical model on the scale of tens of kilometers, as to resolve both the smallest and largest scales in the flow would entail excessive computational expense. There are a number of solutions to the problem of representing this sub-grid scale process, including:
-
Using a coarse scale model to provide input boundary conditions as time series to a highly localized model of the generator array. At some level, this approach will be necessary to restrict the size of the domain to manageable proportions; however, the boundary will generally be chosen to ensure that the flow perturbations within the domain are small at the boundary.
-
Coupling a coarse scale model to a fine scale model of the array where the generators are better represented, and run the two models concurrently. This would require a significant amount of programming and computational effort.
-
Applying forces distributed to nodes within the modelling domain to represent the generators as ‘sinks’ of momentum. The effect of this is to add roughness to portions of the mesh; this method can not reproduce the wake structure behind the turbines, but may be able to adequately reproduce the large scale flow patterns. This solution was chosen and implemented in the TELEMAC model.
Fig. 6 – Difference in flow speed (m/s) when energy extraction is applied in the area indicated by the rectangle. Yellow to red indicates an increase in flow speed at the time-step, green to blue a decrease. White indicates that the magnitude of the change is less than 3 cm/s.
To investigate the effects on tidal flows at Portland Bill, due to a hypothetical array (or ‘farm’) of tidal stream generators, a numerical model of the tidal flows around the Portland Bill headland was developed using the TELEMAC system. The effects of turbines were included in the model as an additional roughness retarding the flow.
The additional roughness was calculated on the basis of 160 generator units consisting of:
- Horizontal axis turbine:
- Diameter 16 m
- Rated speed 2.5 m/s
- Thrust coefficient 0.8
- Thrust (opposing flow) limited to rated thrust (515 kN) for speeds greater than 2.5 m/s (see Figure 5).
Some of the results are presented in Figure 6 as an animated plot of difference in flow speed when energy extraction is applied, compared to that in the natural state. It can be seen that there are reductions in flow speed ahead of and in the wake of the generator array – as expected – but also increased flow speeds on either side of the array, particularly between the array and the headland. It is possible that flow speed changes might have an effect on the mobile sands on either side of the headland.
3D Array simulations

Fig. 7 – Predicted velocity field around 3 rows of marine current turbines.
Initial simulations of arrays of tidal turbines have been performed using FLUENT a computational fluid dynamics (CFD) package. The use of CFD allows analysis of several possible farm simulations with different boundary conditions. Details of these initial simulations have been published in:
Batten W.M.J. and Bahaj A.S. (2006) CFD simulation of a small farm of horizontal axis marine current turbines. Proceedings World Renewable Energy Congress (WREC-IX), Florence, 19-25 August 2006.
A typical simulation, using actuator disks is shown in Figure 7 for 3 rows of turbines. The rows are of infinite width with the use of mirror boundaries. These results show that between the first row of turbines there is a region of flow acceleration akin to a venturi. This could mean that these turbines would produce more power.
Initial Alderney Tidal Race Study
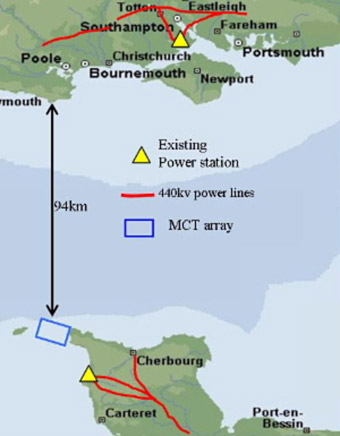
Fig. 8 – The Alderney race has a close location to main grid power infrastructure in France.
The Race of Alderney lies between the channel island of Alderney and Cap de la Hague on the West coast of France (Figure 8). It is a large site and has the possibility of feeding electricity into the channel Island of French mainland grids. The Race is approximately 4 miles wide and there are large areas with mean depths of 30, 35 and 40 m, which are within the expected range of what is anticipated to be the first generation Marine current turbines. The strongest tidal streams are found on the east side where the depths are slightly shallower than the West half. Figure 9 shows that the spring rate of the north going stream is 5m/s (9.5 knots) and that of the south going stream is 3.5m/s (6.75 knots). Flow speeds in the West Race closer to Alderney are still very strong compared to other UK sites.
The relatively discreet depths at certain points within the Race will if necessary facilitate gradual modular installation over a long period of time. As more devices are installed interaction effects will reduce power output and it will be the case that an upper limit for economic energy extraction will be reached. Figure 10 shows the layout of the largest array that was deemed effective in terms of annual energy yield. It has a rated capacity of 1496MW and an annual electricity yield of 1.34TWh.
Fig. 9 – The race of Alderney has high velocity flows with appropriate depths suitable for marine current turbines – large areas with depths of 30, 35 and 40m. The velocity distribution is, for most of the time, greater than the economic minimum for deployment.
In practice, a smaller array based in the East Race would be the most promising in terms of annual load factor (further details in reference 2 below). Figure 11 shows the cyclic nature of power generation over a 14-day period. Although the variation is high, installing similar arrays at sites with offset peak flows would smooth the total output considerably. The resource is also totally predictable which is less problematic for the electrical grid allowing it to forecast output for long periods into the future.
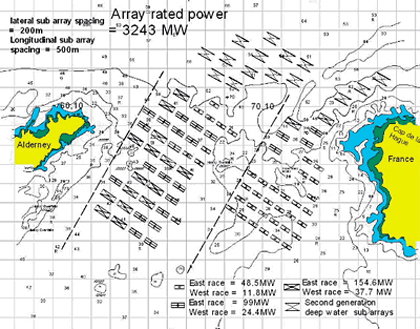
Fig. 10 – Plan view of the full array. (Grids represent 1km)
Further details of this work can be found the following publications:
Bahaj A.S., Myers L.E. (2004) Analytical estimates of the energy yield potential from the Alderney Race (Channel Islands), using marine current energy converters. Renewable Energy, Volume 29, Issue 12, October 2004, pp 1931-1945. View paper
Myers L.E., Bahaj A.S. (2005) Simulated electrical power potential harnessed by marine current turbine arrays in the Alderney Race.Renewable Energy, Volume 30, Issue 11, September 2005, pp 1713-1731. View paper

Fig. 11 – Array power output over a 14-day period of the largest array that was deemed effective in terms of annual energy yield.