The Anaconda wave energy converter, which is shown as an artist’s impression in Figure 1, is a novel concept for wave energy conversion invented by Rod Rainey and Francis Farley and further developed by the licensed manufacturers Checkmate SeaEnergy Ltd. The system essentially consists of a rubber tube filled with water which is placed in the sea. Both ends of this rubber tube are sealed and it is anchored with its head to the waves. It is squeezed or enlarged locally by waves causing pressure variations along its length.

Figure 1: Artist’s impression of the Anaconda wave energy converter (image provided by Checkmate SeaEnergy Ltd).
The Anaconda concept is shown schematically in Figure 2. A running bulge wave is generated by squeezing the water-filled rubber tube. The bulge wave travels at a speed that is determined by the geometry and material properties of the tube. Anaconda is designed so that its bulge wave speed is close to the speed of the external water waves above. In this resonance condition the bulges grow as they travel along the tube, gathering wave energy. Inside the tube, the bulge waves are accompanied by a periodically reversing flow. Localised squeezing and enlarging effects permit energy to be extracted indirectly with a Power Take-Off (PTO). One way of extracting power from Anaconda is to use a pair of duck-bill valves to convert this power into a rectified flow past a turbine between high and low pressure reservoirs. The animation below shows an impression of the Anaconda wave energy converter at full scale.
Figure 2: Anaconda wave energy converter – sketches of the device in waves travelling from left to right, at four phases of the motion, with a power take-off system at the downwave end. Arrows indicate the direction of the oscillatory internal flow
Scale Model Testing and Numerical Simulations
The Sustainable Energy Research Group is involved in the investigation of Anaconda and different modifications of its original design within an EPSRC funded project. The emphasis lies in the development of a better understanding of the hydrodynamics of the device and validated numerical simulations. The numerical simulations conducted by the Fluid Structure Interactions Research Group of the School of Engineering Science include the software MATTHEW for the hydrodynamics and ABAQUS Unified Finite Element Analysis for the structural analysis.
The most comprehensive Anaconda test series conducted by SERG was supported by HYDRALAB-III and carried out at the Danish Hydraulic Institute (DHI) in a wave basin (length × width × depth = 30 m × 20 m × 3 m). The diameter scale of the 0.25 m model tube was about 1:30. A simplified set-up was designed to provide well defined initial and boundary conditions for numerical simulations and to compare the measured data with theoretical predictions. Figure 3 shows some impressions of the experiments at the DHI.

Figure 3: Impressions of the tests at the DHI: (a) box with bulge wave actuator on top and a cylinder with a moving piston inside, (b) tube with strain gauges to measure the bulge wave features, (c) view from the wave basin bottom to tube in test position, (d) wave basin with the boxes fixed on one bridge and the wave gauges on a parallel, movable bridge and (e) artificially generated bulge wave entering the tube and displacing the surrounding water volume
Figure 4 shows the test set-up at the DHI. The bulge waves were artificially generated in still water and by external waves. The bulge wave generator consisted of an actuator moving a piston in a cylinder (Fig. 3(a)). The bulge waves propagated in the rubber tube and lost energy due to radiated waves (Fig. 3(e)) and hysteresis losses in the rubber. The system to absorb the bulge waves (PTO) on the tube end was identical to the system used for the generation. Wooden boxes allowed the rubber tube to act under an overpressure to avoid decompression of the rubber material in a bulge wave trough.
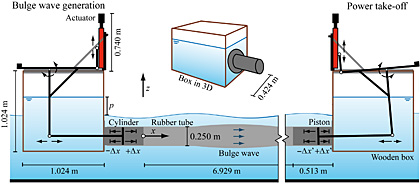
Figure 4: Test set-up at the DHI with bulge wave generator (left), 6.93 m long tube and power take-off (right).