Introduction
The cost of energy is often neglected from many people’s minds and quarterly fuel bills are settled without much attention being paid to the level of energy usage. For many social housing tenants however, fuel bills can be a major source of worry, especially during the winter months when heating bills can represent a major part of a low income family’s expenditure. Alleviating fuel poverty is a key aim of most developed countries and to this end PV can have an important part to play. Although the energy density of PV is quite low in the UK (typical yield of 800 kWh of electricity per kWp of installed PV system per annum for a well designed system) this level of return can make an important contribution to the well being of low income families.
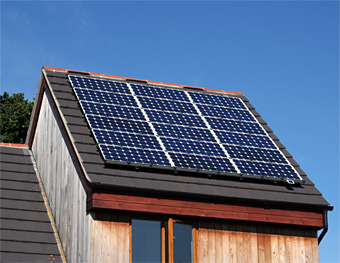
Fig. 1 – Typical residential PV system on a house in Havant, Hampshire.
Residential grid connected PV systems are relatively simple to design with easy to predict annual yields. A typical small residential PV system (1 to 3 kWp) as shown in Figure 1 would cost around £4,500 per kWp installed. An appropriately orientated, unshaded roof in the South of the UK would generate approximately 800 kWh per kWp. A simple estimation of annual income from a PV system is therefore:
Annual income from PV system =
(kWp PV installed) x (yield per kWp) x (avoided cost per kWh)
Annual income from PV system =
1 x 800 x £0.10 = £80 (financial return per kWp)
A simple payback time is therefore =
(capital cost) / (annual income) = (4500 / 80) = 56 years.
Fig. 2 – Value of generated electricity from residential PV arrays and micro wind turbines to the housholder.
The cost of domestic electricity is rising quite rapidly at present in the UK which is beneficial to PV but present metering arrangements are still not ideal to maximise financial return. In general, for UK based microgen systems to be most economic, it is best to avoid export from the house. This is shown in Figure 2 which details the value of generated electricity to a householder with a generation subsidy as it presently exists in the UK. Normally there is a good match between the electrical demand of commercial buildings (day use, peaking with cooling in the summer) and generation from PV. This is not the case with residential buildings however, where there can be high levels of mismatch.
Direct Benefits of PV
The direct benefits to the tenant are essentially a reduction in electricity bills. The 1530 Wp system is predicted to have an annual output of approximately 1500 kWh of electricity. If 80% of the electricity which is generated is used within the home and a green generator tariff (Unit-E) is selected this would correspond to an electricity saving of £132 per annum.
Indirect Benefits of PV
- Tenants taking pride in their housing – this leads to better care of building stock reducing maintenance and repair cost over the building lifetime. Leads to a better living environment.
- Heightened awareness of renewables and the role they have to play in a more sustainable energy generation mix. Increased tolerance to other renewable generation technologies such as wind.
- Increased energy efficiency awareness which can lead to changes in the way energy is used, reducing overall energy consumption.
- Electrical load time period shifting – operation of high demand electrical appliances (dishwasher, tumble dryer, washing machine) at the peak of the solar day as opposed to in the evening when overall demand on the central grid is higher.
New Lane, Havant Eco Homes – Case Study
Fig. 3 – Map of the 9 eco-homes in Havant.
The low energy housing project at New Lane, Havant, near Portsmouth, Hampshire, completed in 2004, incorporates passive solar, solar thermal and photovoltaics into a low energy scheme. In addition, each house has low energy lighting throughout, combined with high levels of insulation and underfloor heating.
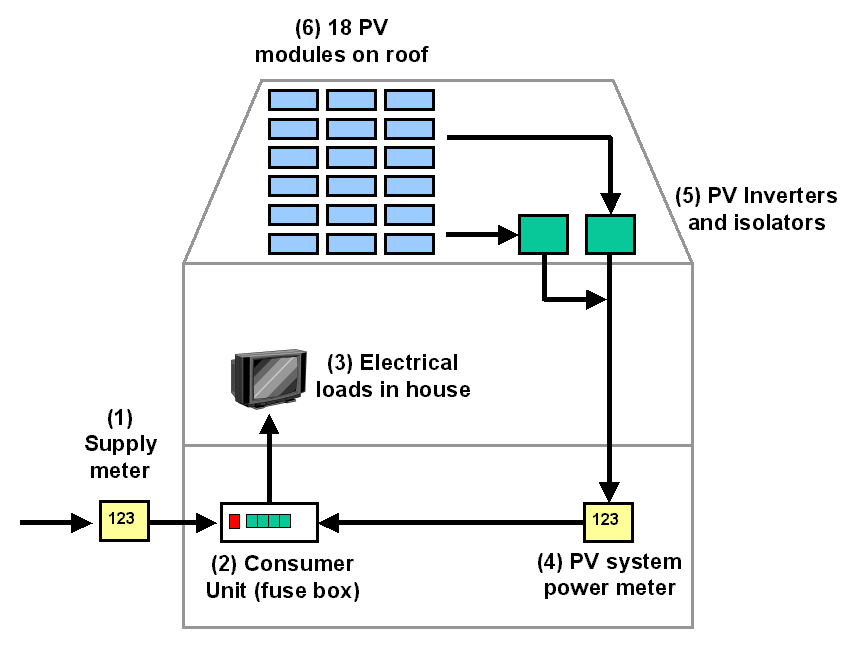
Fig. 4 – Schematic of operation of a domestic PV system
Nine eco-homes (shown in Figure 3) each have a 1.5 kWp PV system and a 4 kW solar thermal system to provide hot water. Each PV system comprises the following:
- 8 x BP585 L laminates produced by BP Solar, roof mounted on a Uni-Strut roof mount system. (1530 Wp). Installer was PV Facades Ltd of Romsey, Hampshire. (Figure 4)
- 2 x SWR700 inverters produced by SMA of Germany
The PV systems have been monitored by the Sustainable Energy Research Group as part of a DTI field trial in photovoltaics. The monitoring scheme looks at the electricity consumption of each house combined with environmental parameters and the performance of the PV system:
- In plane and horizontal irradiance
- Ambient and module temperature
- DC and AC power of each inverter
- Import and Export of electricity from each house to the grid
The collected data is periodically returned to the University using a GSM cellphone.
There are three independent dataloggers. Each datalogger monitors the import and export of electricity from three houses and the performance of the two inverters in each house. The import and export meters are located between the consumer unit and the utility supply of each house. A photdiode / schmitt trigger amplifier device converts the Wh light pulse generated by the meters to a 24V digital pulse (~ 30ms duration) which is recorded by the datalogger. Six inverters are connected to each datalogger using an RS485 daisychain network. A data cable conduit passes between the roofspace of the three linked houses.
Irradiance is measured in plane and on the horizontal using a mono-crystalline sensor (Sensol). Ambient and module temperature are measured using precision platinum resistance thermometers (PT100).
The performance of the PV systems can be viewed on the Internet on a house by house basis with a monthly summary of electricity imported and exported from the grid, generated from the PV system and the predicted and actual performance based on the irradiance received.
Results – PV Generation and Electricity Consumption
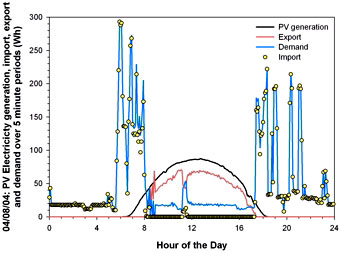
Fig. 5 – Electricity import / export and electricity usage for one eco-house in Havant on a day in April 2004: Electricity usages times and PV electricity generation times are out of phase.
The six South facing roofs (pitch 45 degrees) receive an annual insolation of approximately 1200 kWh/m². The PV systems have a rating of 1530 Wp, assuming a performance ratio of 0.70, which would produce 1285 kWh of electricity per year. (The performance ratio is a measure of how well a PV system performs in comparison to an ideal system and accounts for losses such as inverter efficiency, temperature effects, dc losses and mismatch.) The measured average PV generation from the six houses with South facing PV systems was 1235 kWh which matches closely to the predictions. This annual generation covers about 1/3 of the electricity demand of a typical UK house (~4000 kWh). The two east facing roofs and the west facing roof, receive slightly less sunlight (predicted at ~950 kWh/m²annum) and so will generate slightly less power, ~1020 kWh/annum.
Figure 5 shows a typical daily electricity generation / consuption profile for one of the PV houses in Havant. There is a clear mismatch between PV generation and electricity demand, with the peak generation from the array (South facing slope) occurring when the house is unoccupied. Considering the points raised above on economic return, an operation like this is not economic. This highlights the importance of matching user behaviour and renewable energy generation.
Further results of this work have been published in:
Bahaj A.S. and James P.A.B. (2007) Urban energy generation: The added value of photovoltaics in social housing. Renewable and Sustainable Energy Reviews, Volume 11, Issue 9, December 2007, pp 2121-2136. View paper.
Further details on PV in the built environment can be found in:
Bahaj A.S., James P.A.B. and Jentsch M.F. (2007) Photovoltaics: added value of architectural integration. Proceedings of ICE, Energy, Volume 160, Issue 2, May 2007, pp 59-69. View paper.
Bahaj A.S. (2005) Solar photovoltaic energy: generation in the built environment. Proceedings of ICE, Civil Engineering, Special Issue – Sustainable power, the role for engineers, Volume 158, Special Issue Two, November 2005, pp 45-51. View paper.